Box Plots
Example
We will use our Zillow data from before
| 38 | 60 | 60 | 70 | 90 | 101 | 250 |
Recall that we had:
Q1=60
Q2=70
Q3=101
Step 0:
Draw a number line starting at your minimum value and ending at your maximum value

Step 1:
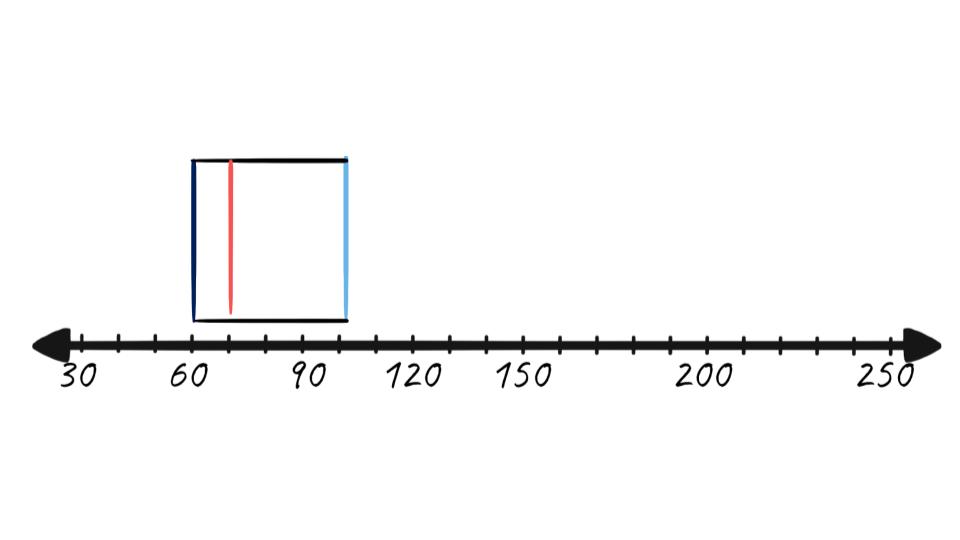
Draw a box from Q1 to Q2

Step 2:
Split the box with a vertical line at the median

Step 3:
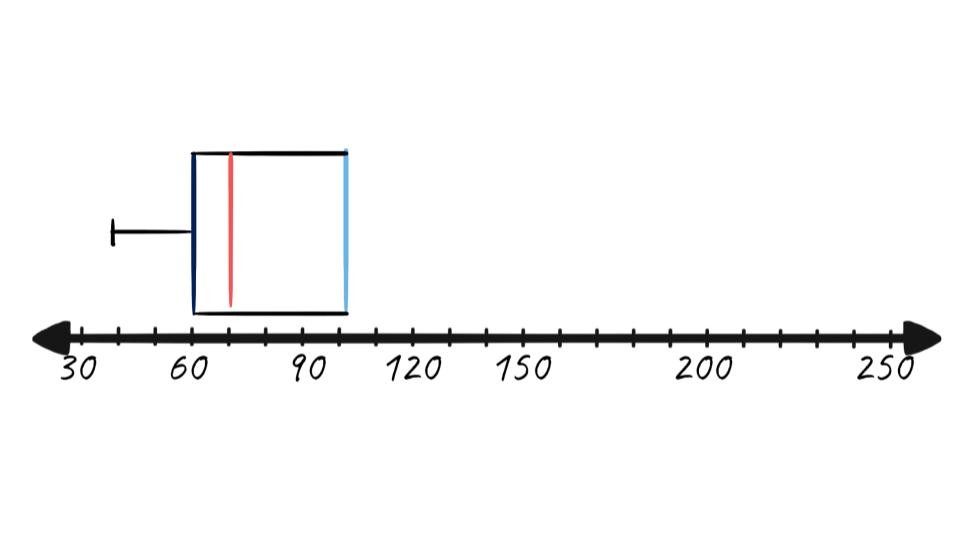
Draw a line from Q1 to the minimum value

Step 4:
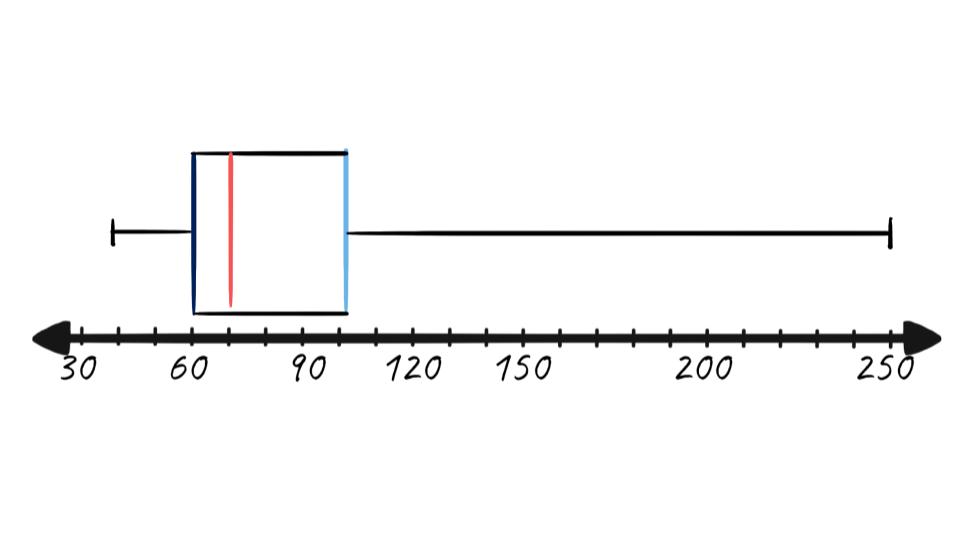
Draw a line from Q3 to the maximum value
